


Practice Growth Operating System™

Great clinics deserve better infrastructure.

Hanix GrowthOS™ replaces disconnected marketing, manual follow-up and operational inefficiencies with one integrated patient growth system for private cosmetic dermatology clinics.

For private practices in the United States, $1M–$10M in annual revenue.

  • 6 modules

    One operating system

  • 6 weeks

    To installed

  • < 60 sec

    Enquiry response target

  • 1 report

    Measured against baseline

The reception of a minimal, luxury cosmetic dermatology clinic in natural daylight, with oak millwork, white stone and floor-to-ceiling glass.

Problem → Solution → Mechanism

How Hanix GrowthOS™ works, end to end.

What is broken in most private practices, what replaces it, and the mechanism that carries a patient from first enquiry to accounted revenue.

  1. The problem01

    Growth sits in four disconnected places.

    Demand depends on referrals, enquiries wait for a free moment, follow-up happens when the day is quiet, and the numbers live in four tools that disagree. None of it is a marketing problem, which is why more marketing does not fix it.

    • Enquiries answered hours — or days — late
    • Consultations that stall without follow-up
    • No single record, no reliable numbers
  2. The solution02

    One operating system, installed into the practice.

    Hanix GrowthOS™ replaces the disconnected parts with a single instrumented pipeline: six modules sharing one patient record, one calendar and one set of numbers, implemented by us and then operated as infrastructure.

    • Six modules, one patient record
    • Installed in six weeks, then run continuously
    • One report, measured against your baseline
  3. The mechanism03

    Demand in, accounted revenue out.

    Every enquiry enters the same pipeline and is carried end to end: acquired, answered in under a minute, converted along a defined pathway, then recalled and reconciled to revenue. Because the loop closes, each stage is measured against the one before it.

    • Acquisition plans demand against real capacity
    • AI Reception answers and books, at any hour
    • Conversion and retention run on schedule

The mechanism, stage by stage

  1. 01

    Demand

    Planned to capacity

  2. 02

    Response

    Under 60 seconds

  3. 03

    Consultation

    Prepared, confirmed

  4. 04

    Treatment

    Pathway followed

  5. 05

    Revenue

    Attributed to source

The problem

Clinical excellence does not distribute itself.

The practices we work with are not struggling because of their medicine. Their outcomes are excellent, their reputation is real, and their patients are loyal. What they lack is an operating layer between the practice and the market.

Growth depends on referrals arriving. Enquiries wait in a voicemail box until someone has a free moment. Follow-up happens when the day is quiet. Four tools hold four partial versions of the same patient. None of that is a marketing problem, which is why marketing has not fixed it.

A practice at $3M with these conditions is not under-marketed. It is under-instrumented.

Why practices plateau

Four conditions produce the same ceiling.

  1. 01

    Growth is delegated to chance

    Referrals and word of mouth built the practice, and they are still the primary source of new patients. That works until the calendar has gaps — and by then there is no mechanism to fill them.

  2. 02

    The first response is too slow

    A prospective patient enquiring about a $6,000 procedure is comparing three practices in the same hour. Most enquiries are answered after the decision has already been made elsewhere.

  3. 03

    Follow-up depends on people remembering

    Consultations that do not close on the day are followed up inconsistently, if at all. The revenue is not lost to competitors; it is lost to an unfinished process.

  4. 04

    Nothing is measured end to end

    Enquiries live in one tool, bookings in another, revenue in a third. Without a connected record, no one can say which treatments and which sources actually build the practice.

Introducing

Hanix GrowthOS™ — one system that runs the growth side of the practice.

GrowthOS™ is not a website, a campaign or a set of tools bolted together. It is a single operating system with six modules that share one patient record, one pipeline and one set of numbers. Demand, reception, conversion, retention and reporting stop being separate activities and start behaving as one process.

  1. 01

    Attract

    Qualified demand

  2. 02

    Book

    Answered instantly

  3. 03

    Convert

    Defined pathway

  4. 04

    Retain

    Clinical cadence

  5. 05

    Measure

    Revenue intelligence

How it works

Installed once, then operated continuously.

GrowthOS™ is implemented into your practice and then run as infrastructure — not delivered as a project and handed over.

01

Install

We map your treatments, providers, capacity and clinical criteria, then configure GrowthOS™ around how your practice already operates.

02

Integrate

Phones, forms, calendars, records and reporting are connected into one instrumented pipeline, so a patient is a single continuous record rather than five disconnected entries.

03

Operate

The system runs daily. We monitor performance, refine the pathway and review the numbers with you on a fixed cadence.

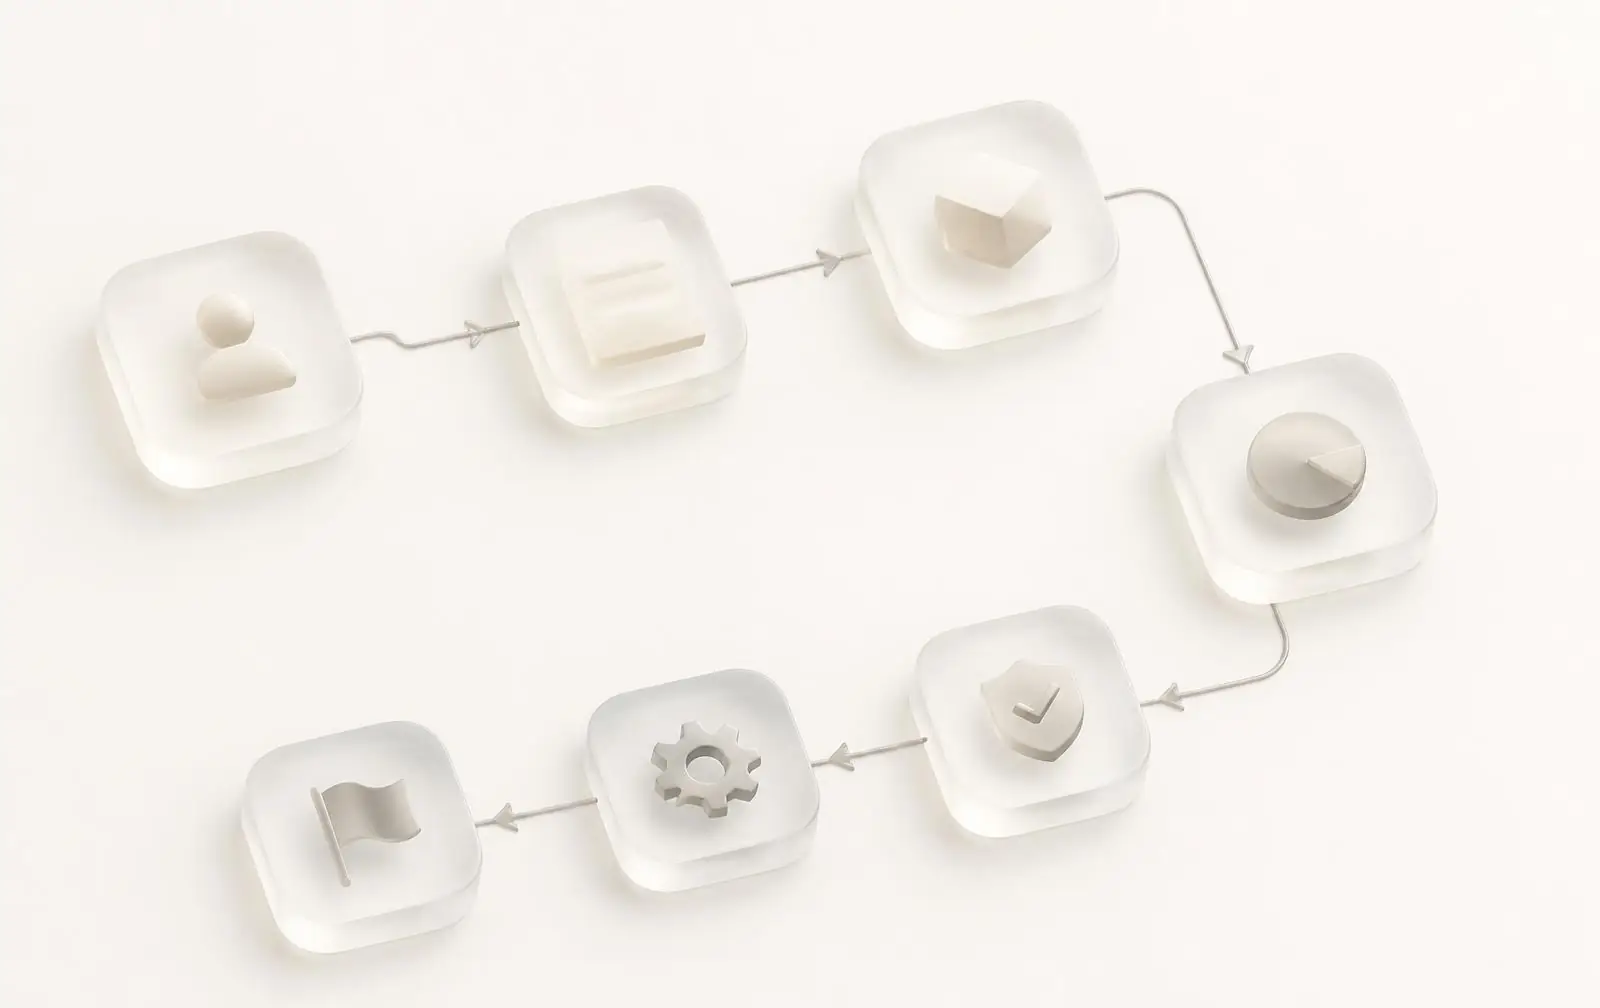
An isometric diagram of seven connected glass nodes representing the patient journey from search through to referral.
One continuous pathway: search, website, consultation, treatment, follow-up, retention, referral.

The modules

Six modules. One operating system.

Each module owns a stage of the patient lifecycle. Together they form a closed loop that can be measured end to end.

Module 01

Patient Acquisition

A dependable source of qualified consultation requests.

Demand is treated as an operational input, not a campaign. The module maintains a consistent flow of qualified enquiries for the treatments your practice actually wants to perform, and every enquiry enters the same instrumented pipeline so its value can be measured to the procedure.

  • Treatment-level demand planning
  • Qualified enquiry routing
  • Source-level attribution
  • Capacity-aware pacing

What changes

What the practice looks like once it is running.

Predictable consultation volume

Demand becomes a planned input matched to available chair time, instead of a monthly unknown.

A front desk that is no longer the bottleneck

Every enquiry is answered and triaged immediately. Your team handles the conversations that require judgement.

Revenue you can explain

You know what each treatment, provider and source contributes, and what it costs to acquire.

Less operational load on the owner

The process runs without you holding it together, which is the only way a practice grows past its founder.

The reporting layer

One report an owner can act on.

Revenue Intelligence and Practice Analytics resolve into a single view — response times, booking rates, conversion, capacity and revenue by treatment, provider and source.

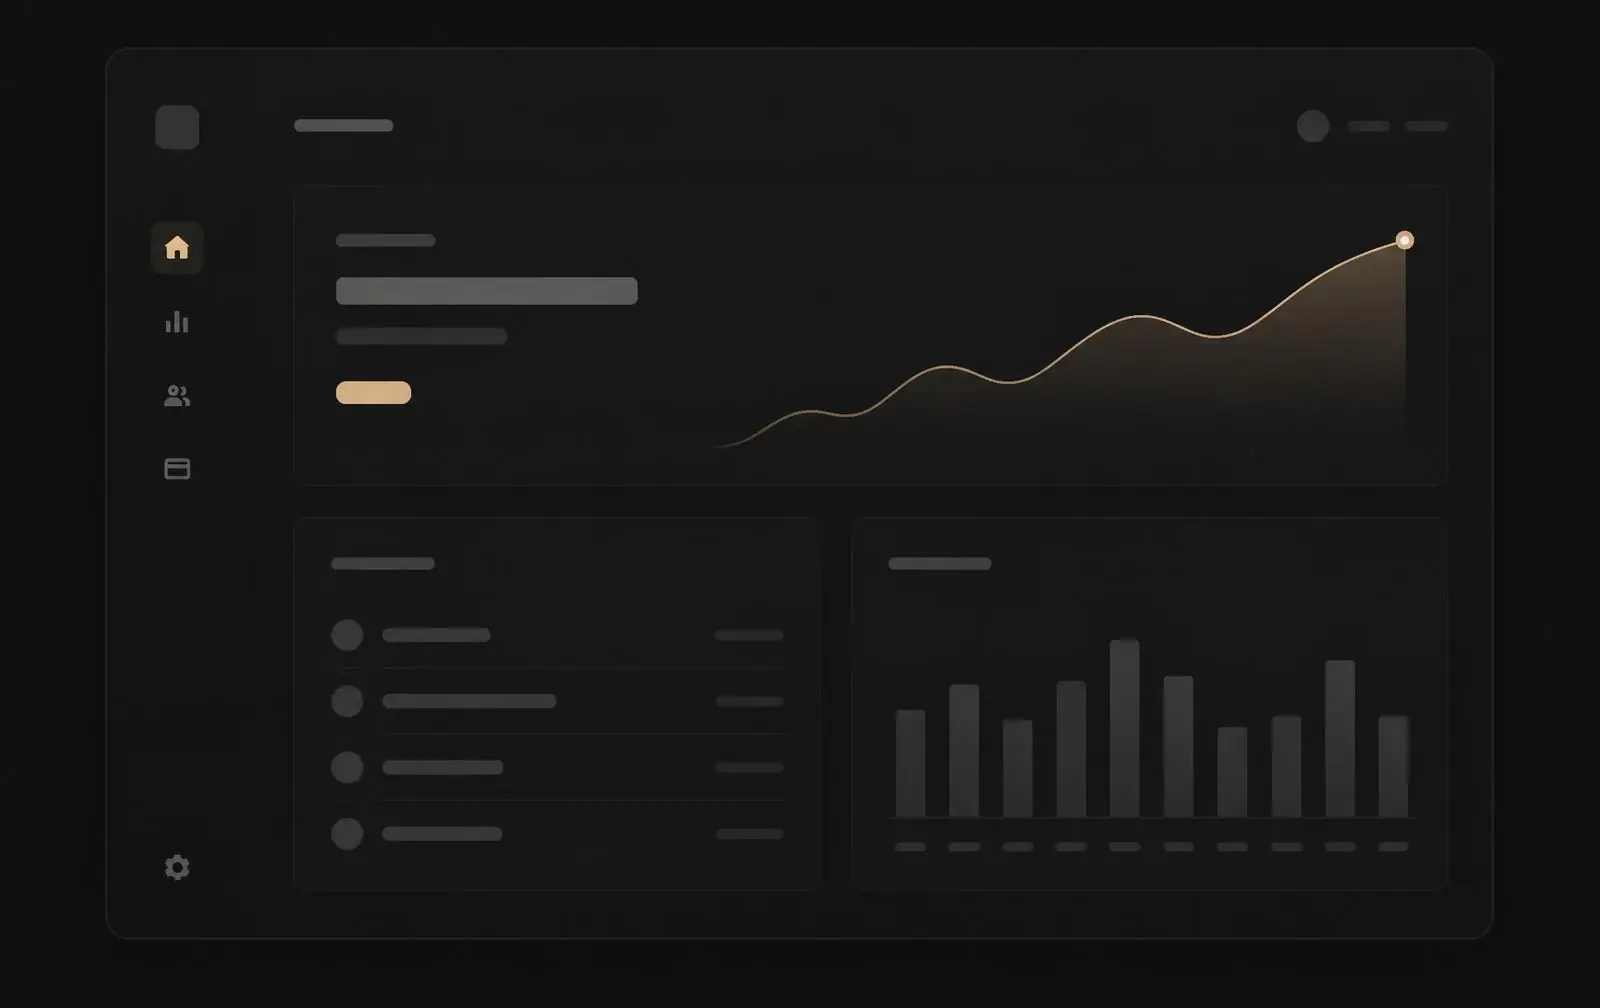
A restrained dark-mode analytics interface floating against a near-black background.
Representative interface. Every practice sees its own instrumented numbers, against the baseline recorded before installation.

The system map

End to end, acquisition to accounted revenue.

One connected pipeline rather than four disconnected tools. Each stage receives a defined input, produces a defined output and hands off to the next — and the measured outcome returns to the top.

  1. Stage 01

    Acquisition

    Demand enters as an operational input, tagged before it ever reaches your team.

    In

    Treatment demand plan

    Search, referral, social

    Out

    Qualified enquiry

    Source attribution

  2. Stage 02

    AI Reception

    Every enquiry answered immediately, triaged, then booked or handed over.

    In

    Calls, forms, messages

    Your triage criteria

    Out

    Booked consultation

    Escalation with context

  3. Stage 03

    Conversion

    Preparation, reminders and follow-up run on schedule instead of by memory.

    In

    Booked consultation

    Clinical pathway

    Out

    Treatment plan accepted

    Structured follow-up

  4. Stage 04

    Operations

    Capacity, recall and revenue resolve into one reviewed report.

    In

    Treatment schedule

    Recall intervals

    Out

    Accounted revenue

    Retention cadence

Revenue Intelligence feeds measured outcomes back into the demand plan

Closed loop

Proof & outcomes

A measurement standard you can hold us to.

Every engagement starts by recording a baseline. These are the indicators that change once GrowthOS™ is installed, and exactly how each one is reported.

First response to a new enquiry

Measured on every inbound call, form and message.

Before

Hours, or the next business day

After

Under 60 seconds, every channel

Enquiries answered

Escalations reach your team with full context.

Before

Missed calls after hours and at capacity

After

Answered and triaged continuously

Follow-up on unclosed plans

Every open treatment plan has an owner and a next step.

Before

Manual, dependent on front-desk load

After

Sequenced and monitored to completion

Attribution of revenue

Acquisition cost reported per procedure.

Before

Estimated by impression

After

Traced by treatment, provider and source

Reporting cadence

Same view for you, your team and us.

Before

Disconnected tools and spreadsheets

After

One report, reviewed on a fixed rhythm

Instrumented from day one

  • Response time to every enquiry
  • Booking rate by source and treatment
  • Consultation show rate
  • Consultation-to-treatment conversion
  • Revenue per patient
  • Acquisition cost per procedure
  • Retention and recall performance
Customer results

Named results are published only with written consent.

Cosmetic dermatology is a private business and patient demand is confidential. We do not publish invented figures, borrowed screenshots or anonymous testimonials. When a practice agrees to release its numbers, the result appears here with the practice named, the baseline stated and the measurement window disclosed.

Until then, we will walk you through live instrumentation from a current engagement in a strategy session, under mutual confidentiality.

Before/after indicators above describe the operating standard GrowthOS™ is held to against your own recorded baseline — not results from another practice.

Exhibits

What the system looks like once it is running.

Dashboards, scheduled-opportunity boards and owner reports taken from live installations — the same views your practice reviews on a fixed rhythm.

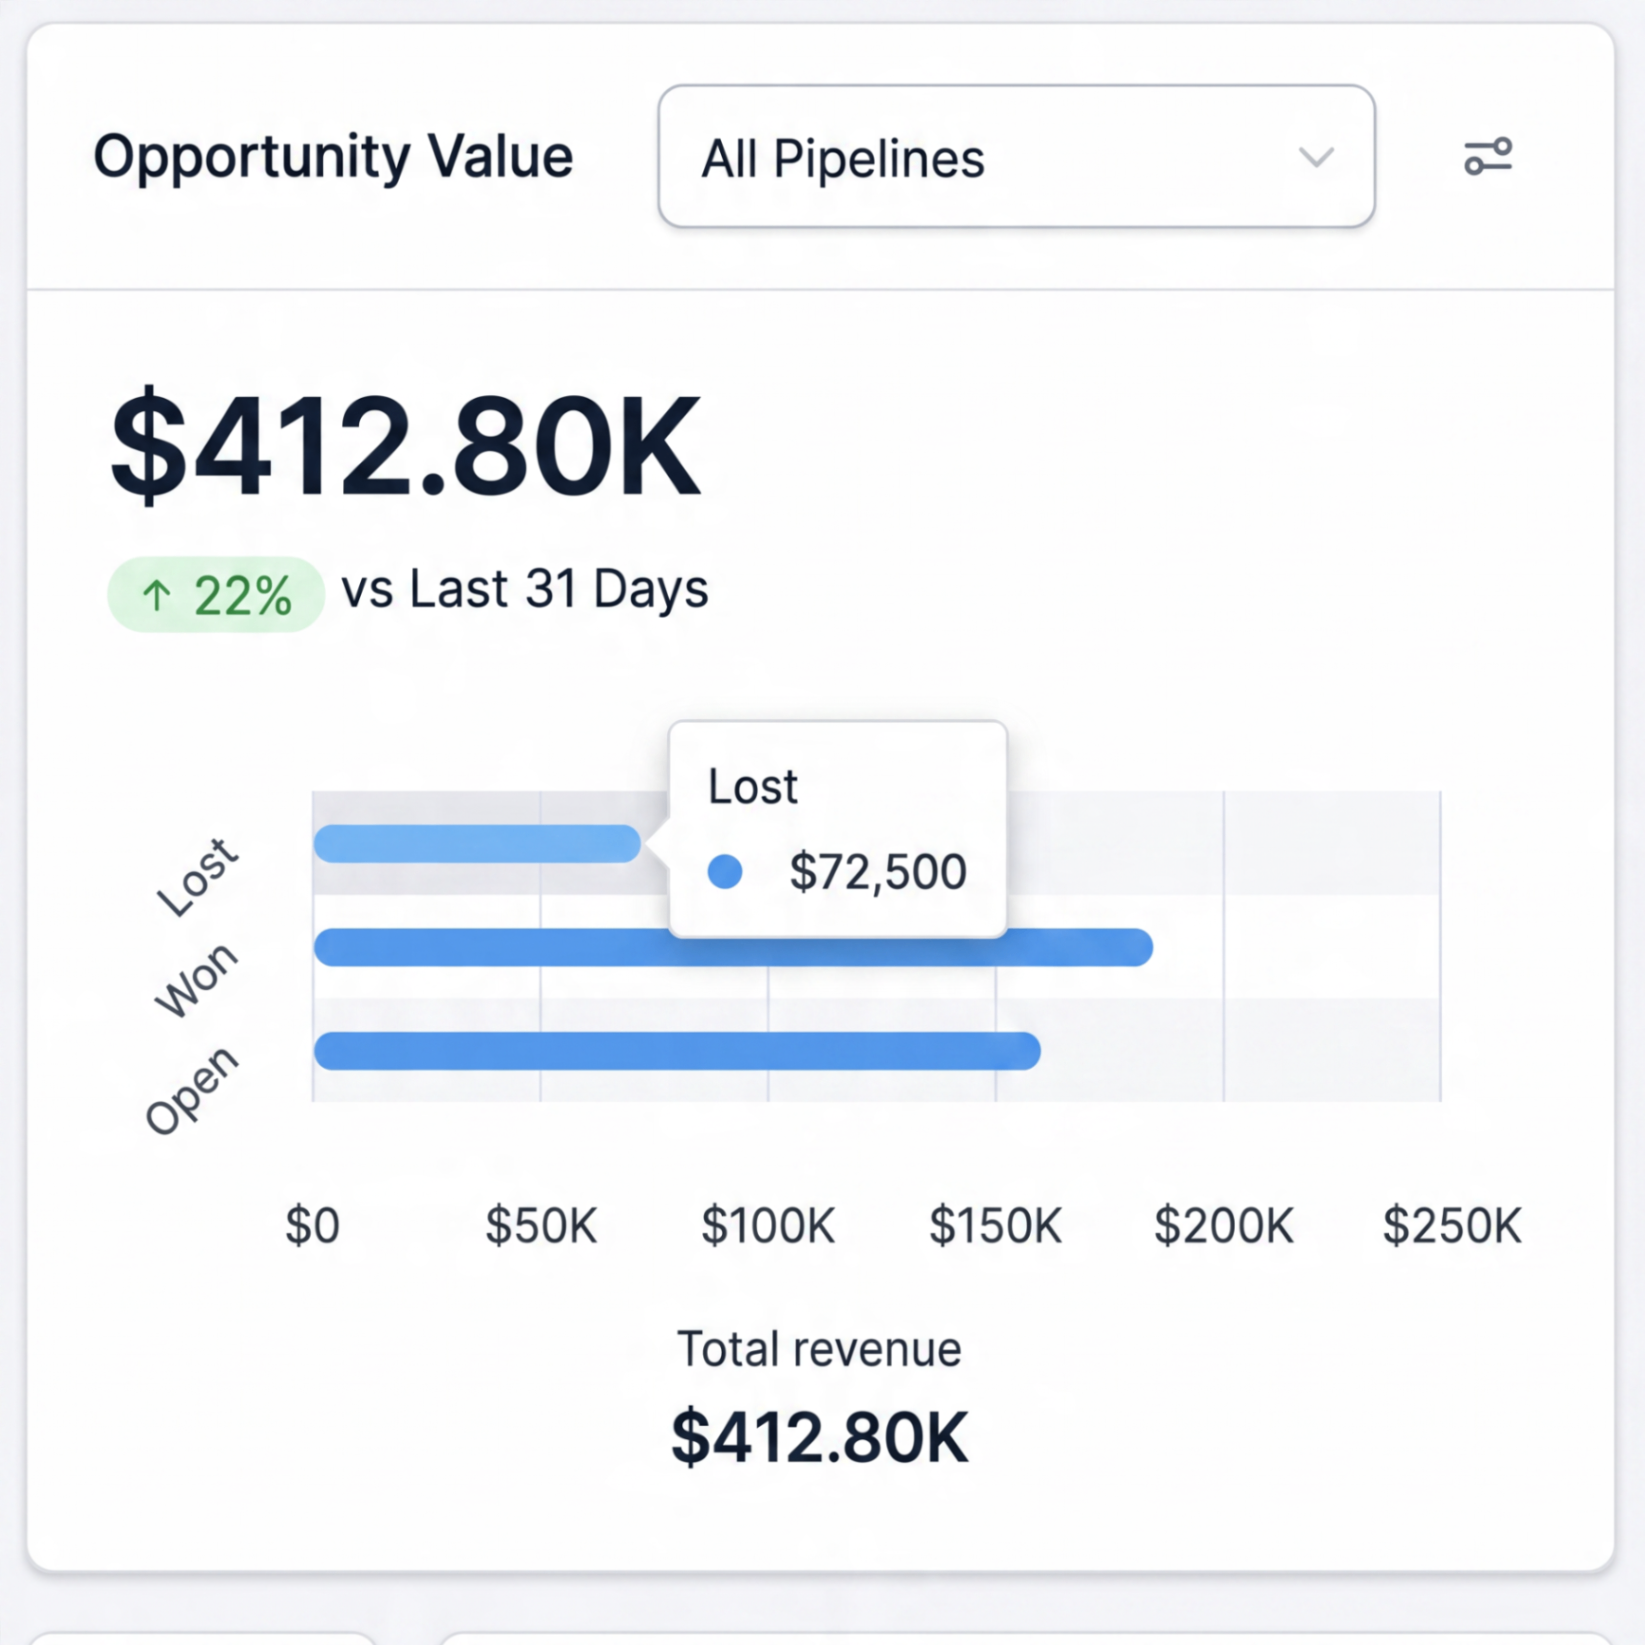
  • Revenue intelligence

    Pipeline dashboard showing $412.80K opportunity value, up 22% versus the prior 31 days

    Opportunity value by stage — won, open and lost, tracked against the prior period.

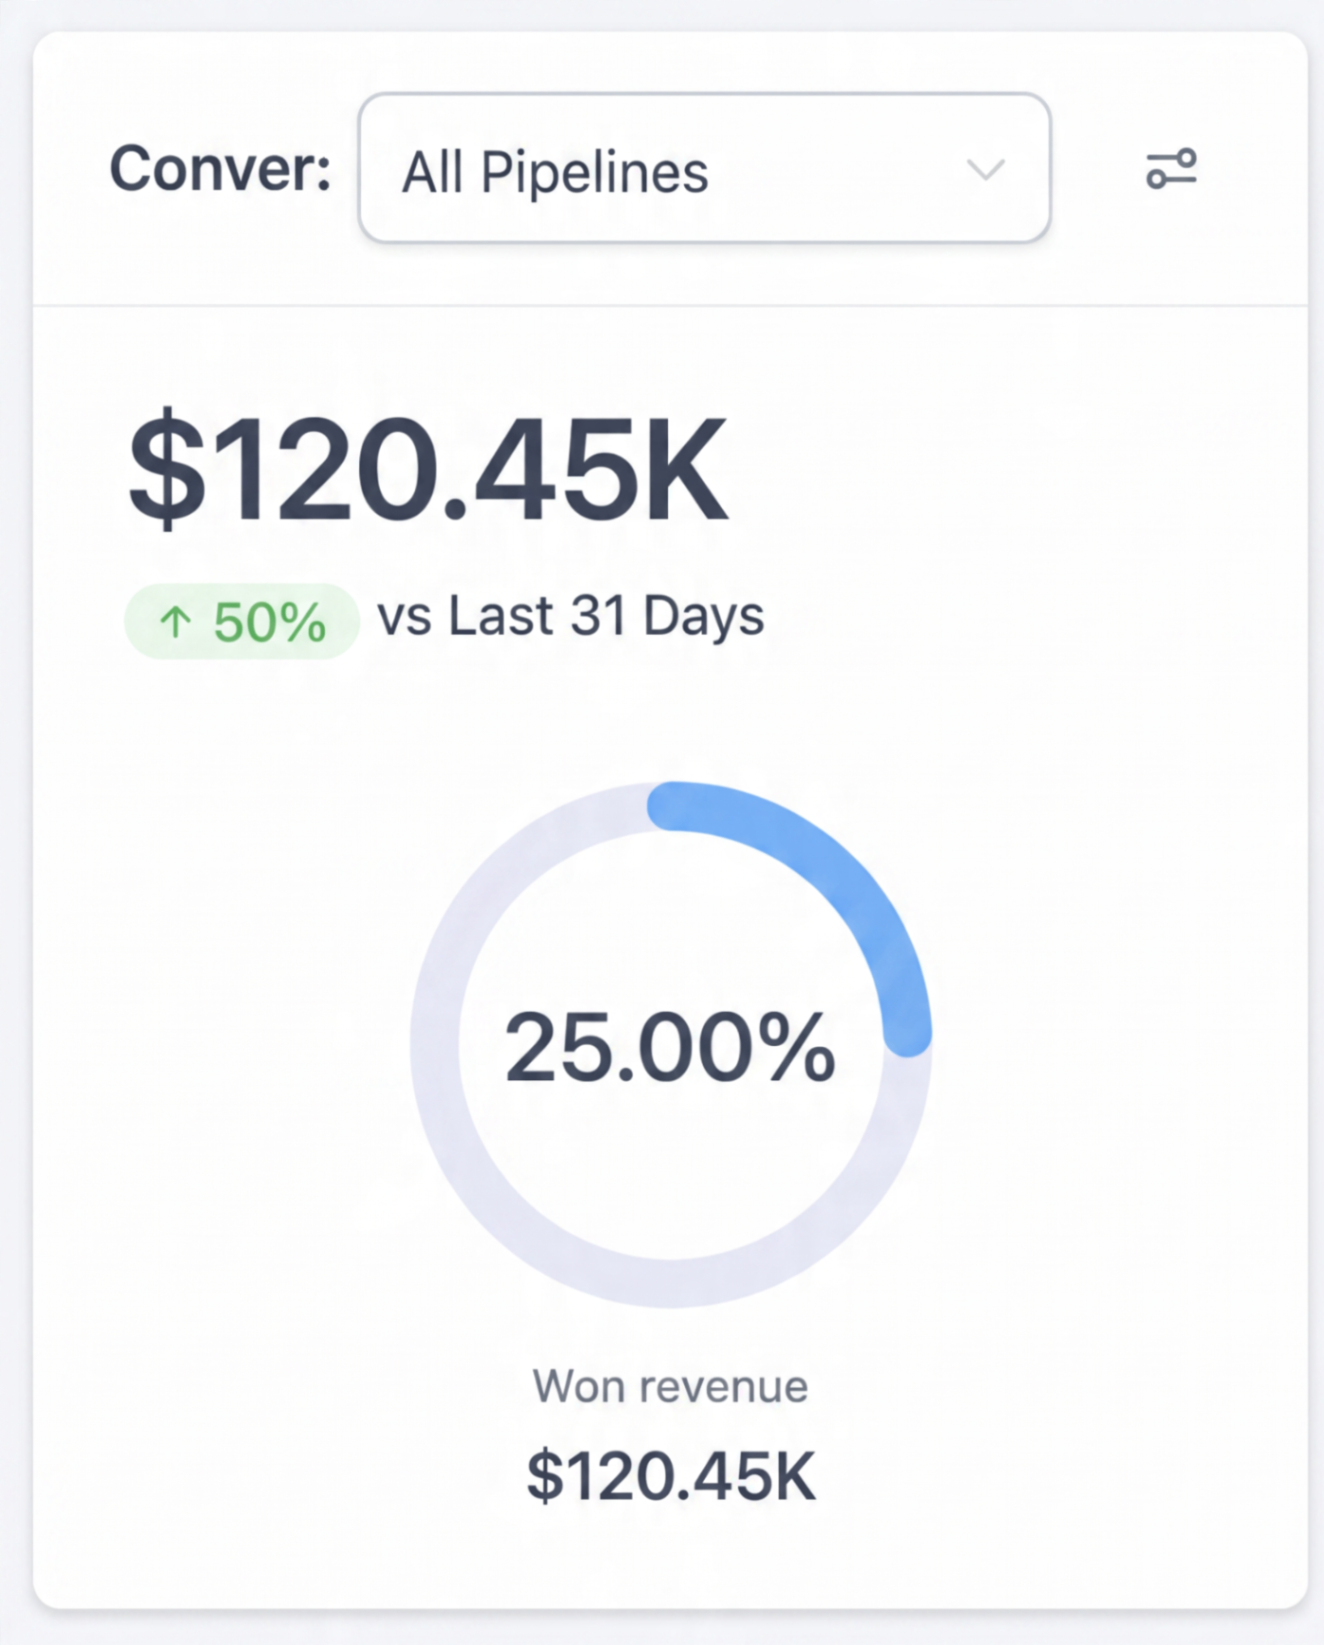
  • Conversion

    Conversion dashboard showing a 25% close rate and $120.45K in won revenue

    Consultation-to-treatment conversion reported alongside won revenue.

  • Acquisition

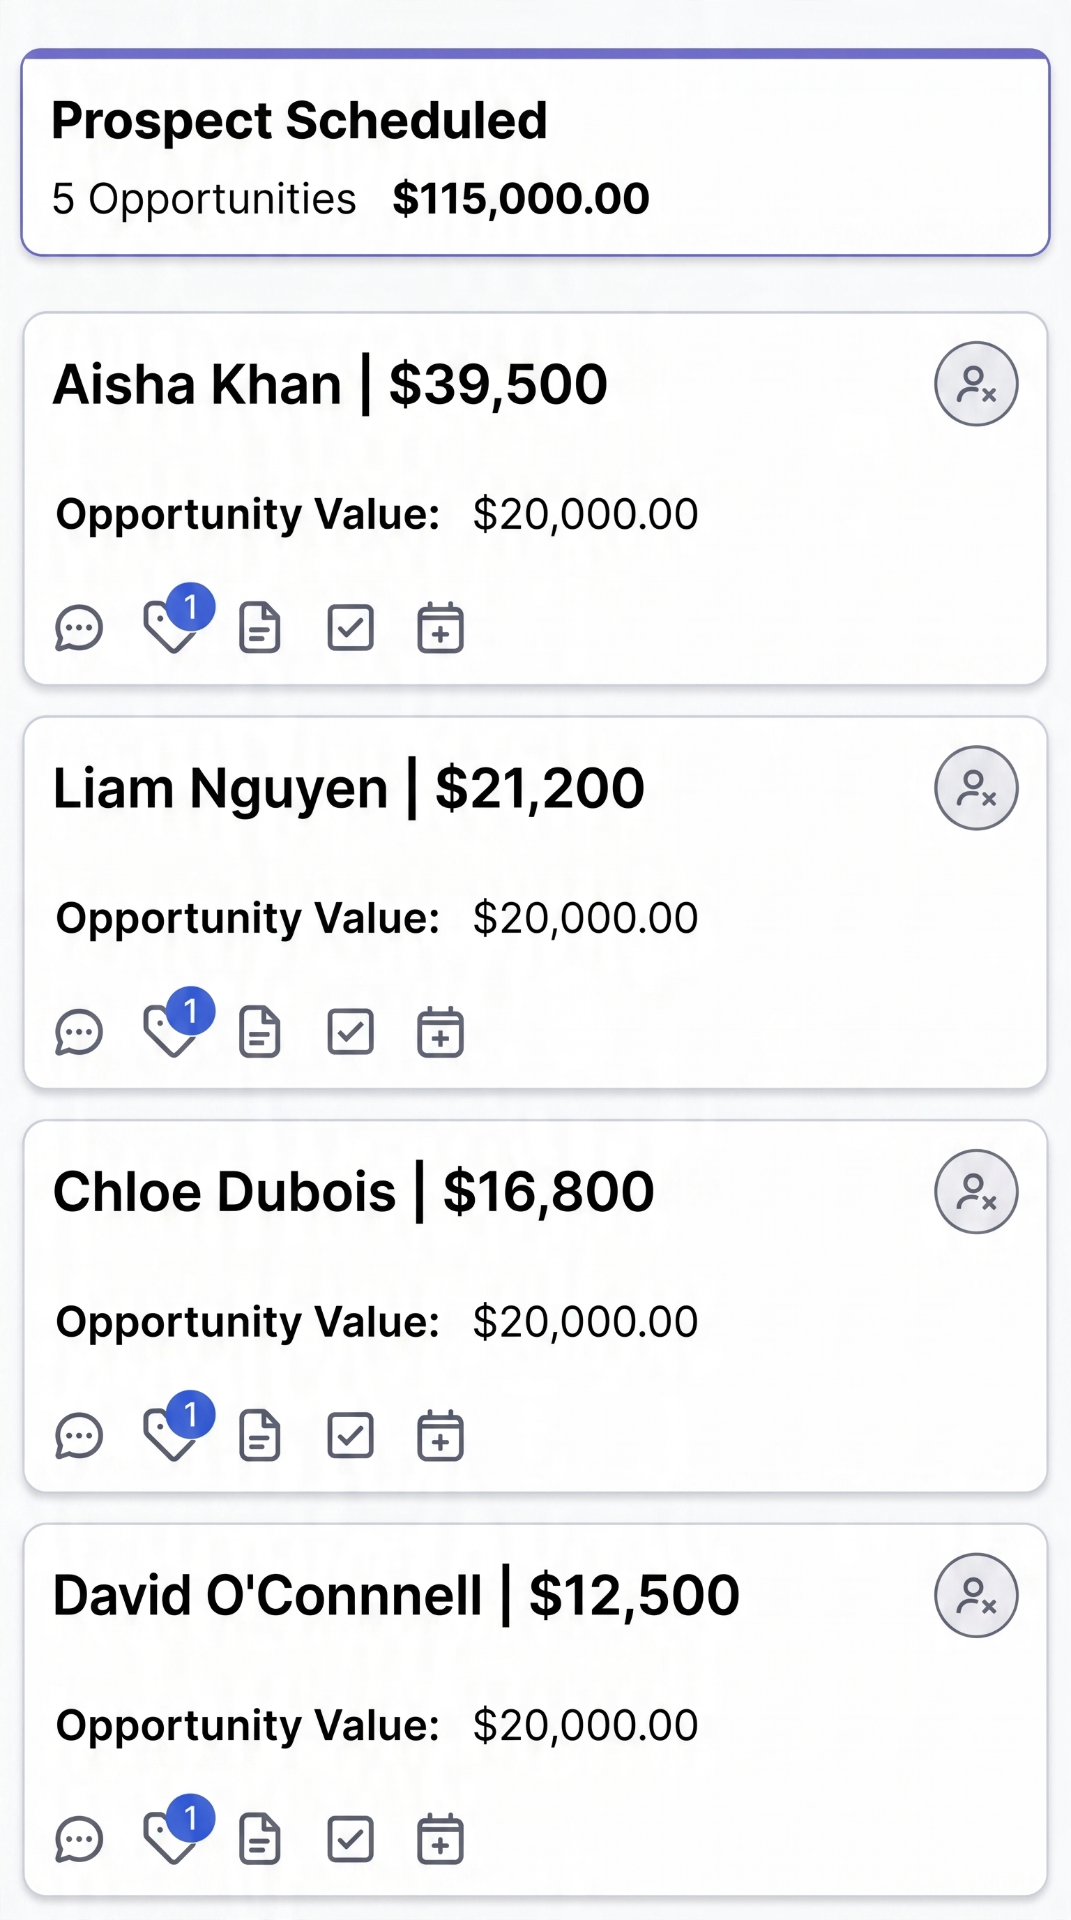
    Scheduled prospect board listing five booked opportunities totalling $115,000

    Scheduled consultations with plan value attached, each with an owner and next step.

  • Instrumentation

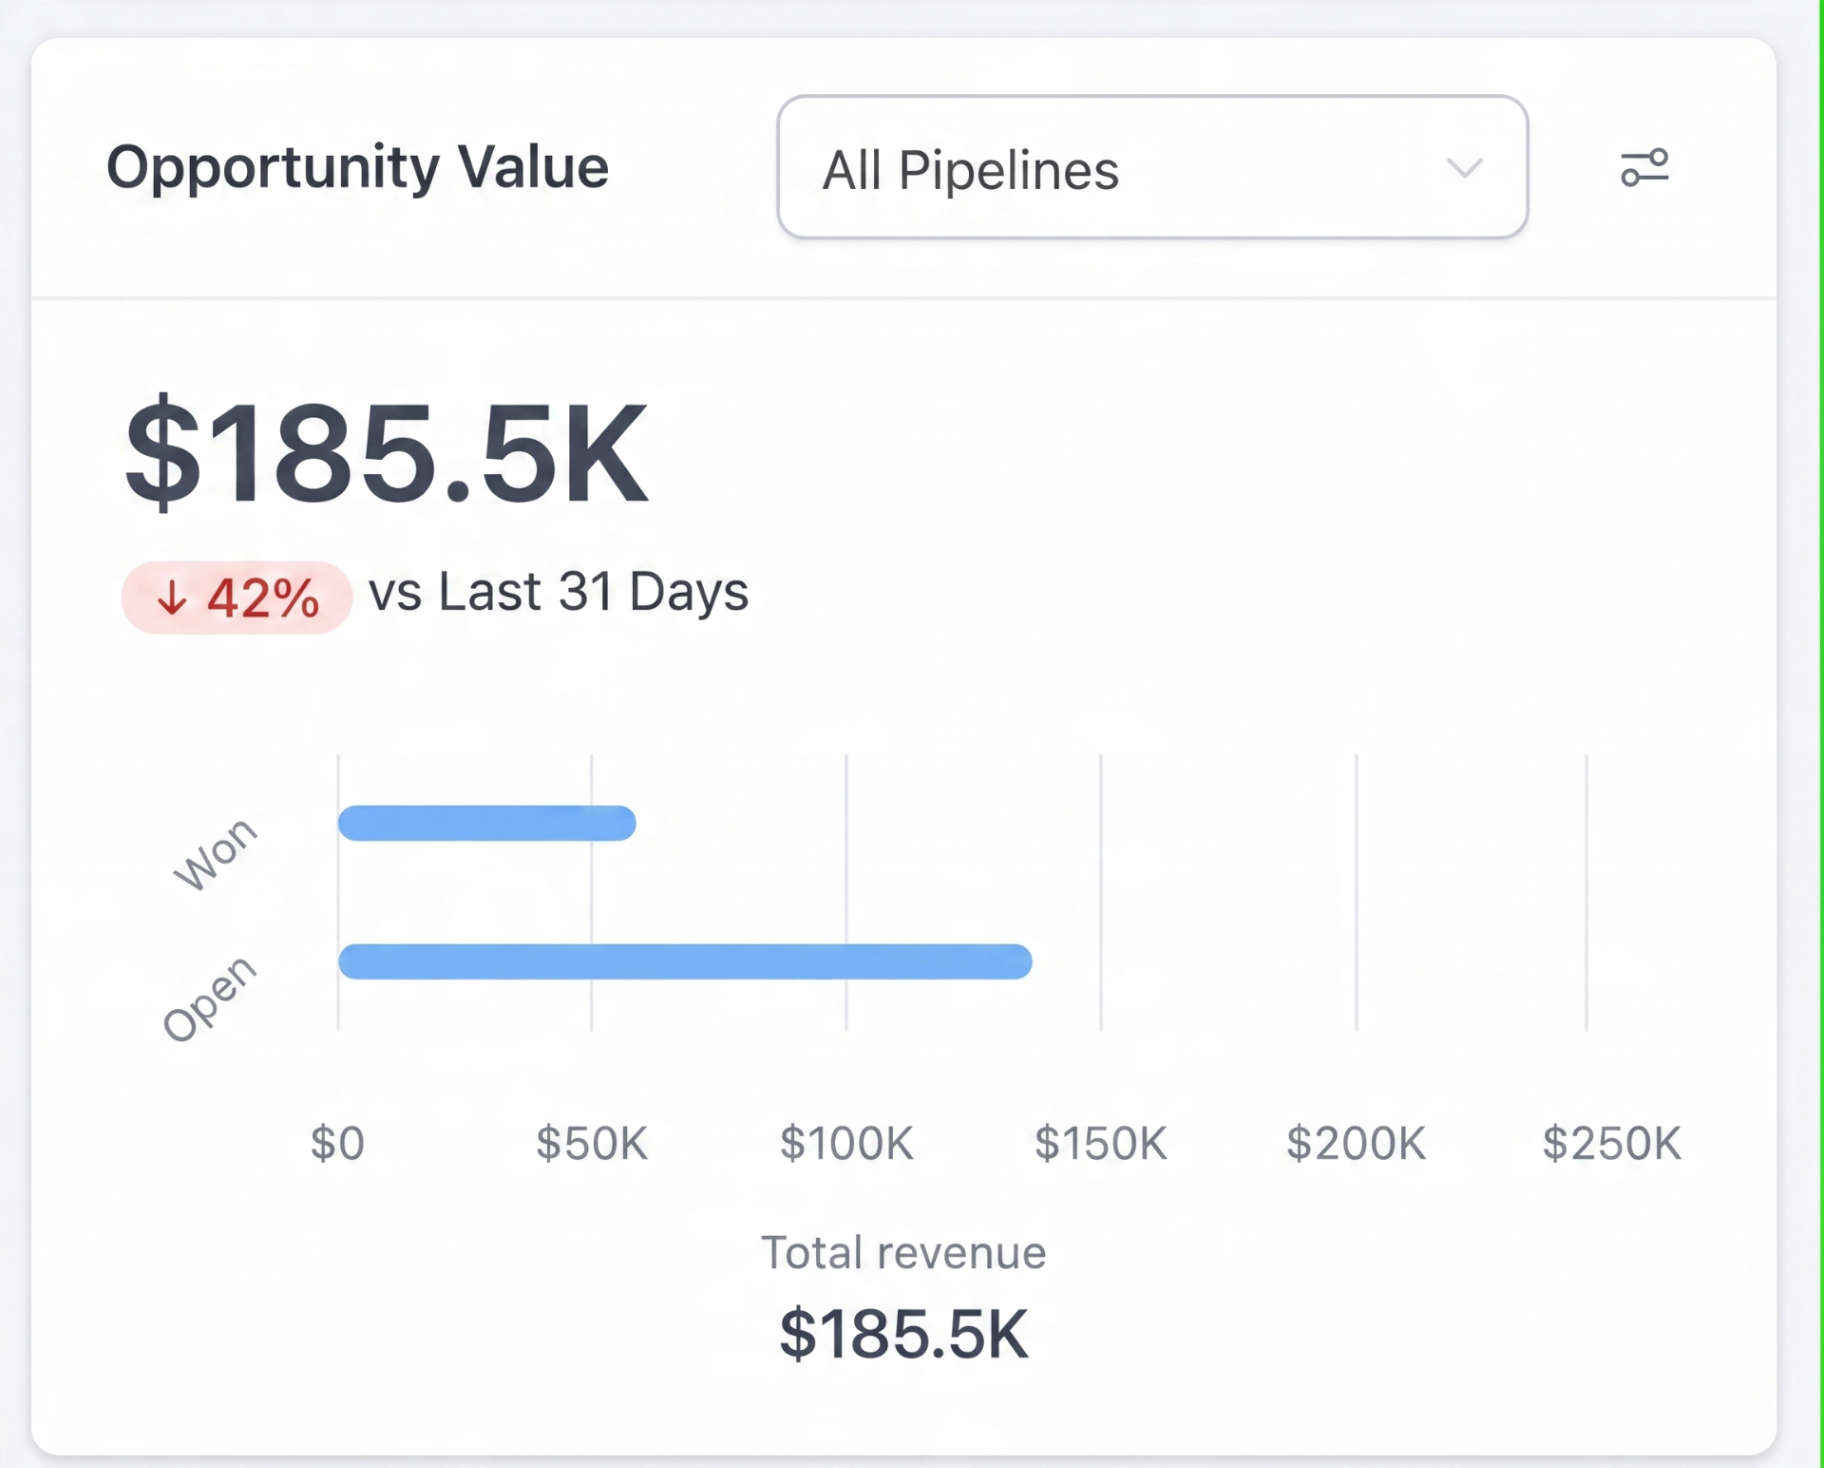
    Pipeline dashboard showing $185.5K opportunity value, down 42% versus the prior 31 days

    A soft month is visible the week it happens — including when the number falls.

  • Reported by the owner

    Owner message reporting $75,000 collected in the first ten weeks

    Collected revenue in the first ten weeks after installation.

  • Reported by the owner

    Owner message reporting $9,850 collected in the first ten days of a campaign

    First ten days of a demand plan going live.

  • Reported by the owner

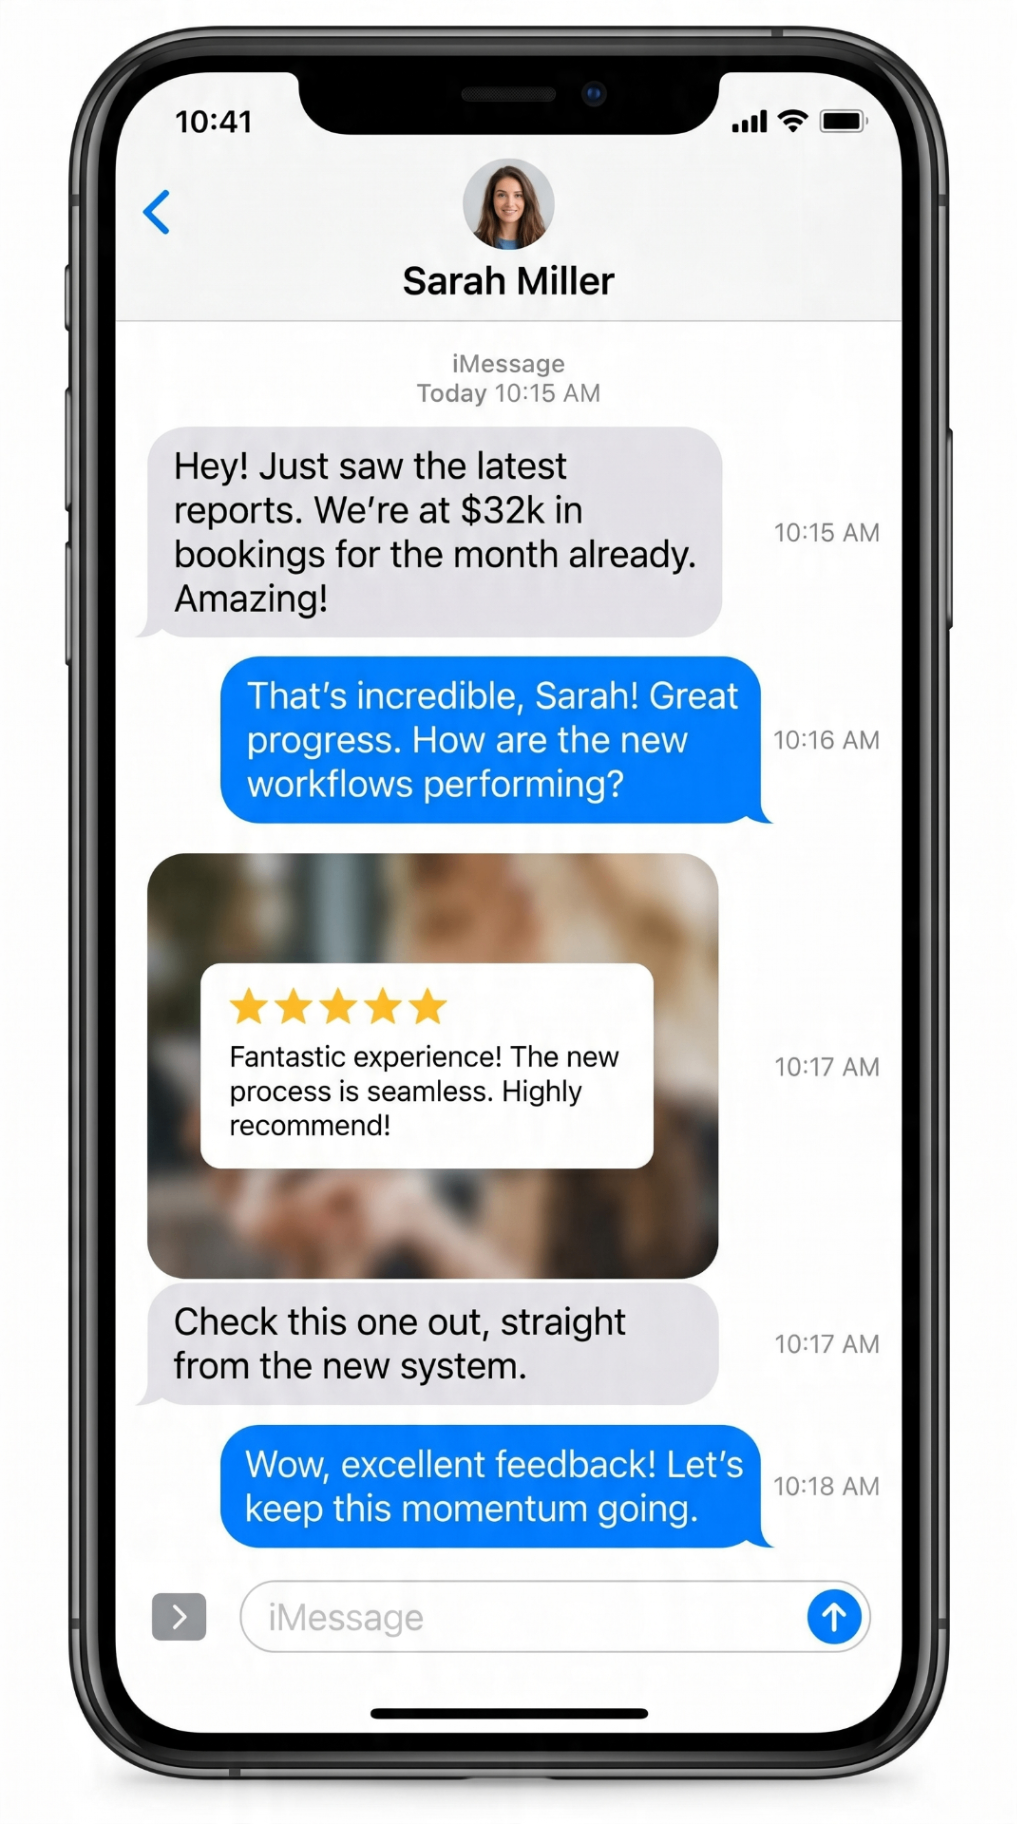
    Owner message reporting $32,000 in bookings for the month and a five-star patient review

    Month-to-date bookings alongside patient feedback captured by the retention module.

Screens are taken from live installations. Patient and practice identifiers are redacted or substituted; named clinic results are published only with written consent.

In their words

Practice owners on what changed.

Three owners describing what the practice was doing before GrowthOS™ was installed, and what it does now.

Enquiries stopped falling through the cracks.

JeffPractice owner

The follow-up runs whether we remember it or not.

DavidPractice owner

For the first time the numbers actually agree.

SharynPractice owner

Unscripted

Recorded by practice owners after GrowthOS™ was installed. No incentives, no edits.

Case studies

Installations, measured against their own baseline.

Four anonymised practices, the constraint that was limiting growth, and what the numbers did once GrowthOS™ was running.

AI Reception

Injectables-led practice, 2 providers

Southeast US · $2.4M revenue band

Enquiries arriving after hours went unanswered until the next morning.

First response time
Baseline6h 40m average
After38s average
Enquiries answered
Baseline61%
After100%
Consultations booked / month
Baseline34
After58

Baseline recorded over 30 days · measured at day 90

Conversion

Laser & skin practice, 4 providers

Mountain West US · $4.1M revenue band

Consultations were booking, but treatment plans closed inconsistently.

Consultation show rate
Baseline72%
After89%
Consult-to-treatment
Baseline41%
After56%
Revenue per patient
Baseline$1,180
After$1,640

Baseline recorded over 60 days · measured at day 120

Acquisition

Single-site cosmetic dermatology, 1 provider

Northeast US · $1.6M revenue band

Growth depended entirely on referrals and one seasonal ad campaign.

Qualified enquiries / month
Baseline48
After112
Cost per booked consult
Baseline$310
After$164
Revenue attributed to source
BaselineNot tracked
After94% traced

Baseline recorded over 30 days · measured at day 150

Retention

Multi-location group, 7 providers

Southwest US · $8.7M revenue band

Recall and retention were handled manually at each front desk.

Recall completion rate
Baseline23%
After68%
Repeat treatment revenue
Baseline31% of total
After47% of total
Owner reporting cadence
BaselineAd hoc spreadsheets
AfterWeekly, one report

Baseline recorded over 90 days · measured at day 180

Practices are anonymised by profile and revenue band. Named results are published only with written consent, and every figure above is measured against that practice’s own recorded baseline over the window stated.

Find out what your practice is currently leaving on the table.

A strategy session is a structured review of how patients currently enter, book and convert in your practice, and where the system is losing revenue. No presentation, no pressure.

  • 45 minutes
  • No presentation, no pitch
  • Reply within one business day

Private cosmetic dermatology practices only. United States. $1M–$10M in annual revenue.

An empty, light-filled cosmetic dermatology consultation room with stone, glass and oak surfaces.

Strategy session

45 min · no pitch

Request